September 7, 2026
·By Ryo Shibata, CTO
Safety Stock: How Much Buffer You Actually Need
Most safety stock advice online reaches for a Z-score and a standard deviation table within the first paragraph. That math is real and it works, but it also assumes you’re already tracking demand variance and lead time variance as clean statistical inputs, which most small distributors aren’t and don’t need to be. Safety stock is a simpler idea than the formulas make it look: it’s the buffer between “what I expect to sell” and “what actually happens,” and you can size it well without a statistics background.
What safety stock actually is
Safety stock is the extra inventory you hold on top of expected demand during lead time, specifically to absorb the two things that don’t go according to plan: a supplier that ships later than usual, and a sales week that runs hotter than average. It’s the buffer portion of a reorder point, not the reorder point itself: the reorder point is demand-during-lead-time plus safety stock, and safety stock is the part sized to cover surprise, not the baseline.
Zero safety stock means every SKU is one late shipment or one busy week away from a stockout. Too much safety stock means cash sitting in inventory that could be funding something else, and a warehouse full of stock that’s protecting against a scenario that rarely happens. The right number sits between those two, sized to how unpredictable a specific SKU’s demand and lead time actually are, not a flat percentage applied across the whole catalog.
The practical formula
The simplest version that still holds up: look at your worst realistic case for both demand and lead time over your recent order history, not a hypothetical extreme, and compare it to your average case.
Safety stock = (max daily sales x max lead time) - (average daily sales x average lead time)
Worked example: a SKU averages 15 units a day with a 10-day average lead time, so expected demand during lead time is 150 units. Over the last several orders, the busiest single day sold 25 units and the slowest delivery took 15 days. Max-case demand during lead time is 25 x 15 = 375 units. Subtract the average case (150) and the gap is 225 units. That’s your safety stock: not a guess, and not a statistics exercise, just the honest distance between what usually happens and what has actually happened at its worst.
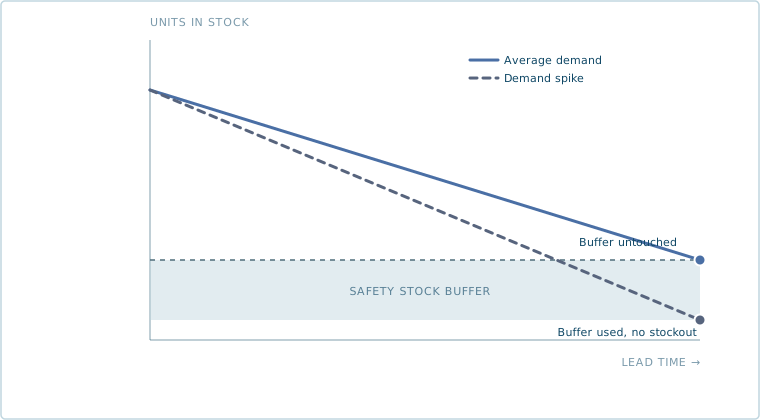
Under average demand the buffer goes untouched. Under a demand spike it absorbs the difference, which is exactly what it’s sized to do.
This version deliberately skips standard deviation and service-level Z-scores. They produce a more precise number if you have enough clean historical data to calculate variance reliably, which most small operations don’t have the order volume or the record-keeping to do well. The max-minus-average method uses numbers you already have: your actual worst day and your actual worst lead time, both real events rather than a statistical projection.
Why a flat safety stock number gets both ends wrong
A common shortcut is picking one buffer, say two weeks of average sales, and applying it to every SKU. That treats a steady, predictable seller and an erratic, spiky one as if they carry the same risk, which they don’t.
A bestseller with tight, consistent daily sales and a reliable supplier barely needs a buffer at all: its worst case isn’t far from its average case, so a flat two-week buffer overprotects it and ties up cash that didn’t need to sit there. A SKU with lumpy demand, big spikes around a promotion or a seasonal pull, paired with a supplier whose lead time has been slipping, needs a much bigger buffer, and a flat number sized for the average SKU will underprotect exactly the ones most likely to stock out. Safety stock has to be calculated per SKU, using that SKU’s own variability, not borrowed from a catalog-wide average.
How lead time variability changes the number more than demand does
Of the two inputs, lead time swings tend to move the number more than demand swings for most distributors, and it’s the one people underweight. A supplier that’s usually reliable but occasionally runs a week late turns “expected demand during lead time” into a moving target even when sales pace hasn’t changed at all. If you’re only watching your own sales history and not tracking how much a specific supplier’s actual lead times vary order to order, you’re missing the input that usually matters more.
The fix is the same one reorder point math uses: track actual lead times per supplier, not just the number they quote you, and use the real worst case you’ve seen rather than their stated average. A supplier who says “10 days” but has delivered in as long as 16 needs a safety stock buffer sized around that 16-day reality, not their marketing number.
Setting safety stock for a new SKU with no history
None of the above works without sales and lead time history, which a brand new SKU doesn’t have. The practical move is the same one used for setting a reorder point on a new product: borrow the safety stock ratio from the closest comparable SKU you already carry, similar price point, similar customer, similar supplier, rather than inventing a number from nothing. Start slightly more conservative than that comparison suggests, since you have no track record yet to confirm the comparison holds, and revisit the number once you have 30 to 60 days of real sales to replace the borrowed figure with an actual one.
The real cost of getting it wrong in either direction
Too little safety stock produces the visible failure: a stockout, a backordered item, a customer told to wait. Too much produces a quieter one that’s easier to ignore: cash tied up in inventory that isn’t moving, which for a slow SKU can slide into outright dead stock rather than a useful buffer. Both failures come from the same root cause, a number that doesn’t reflect that SKU’s actual variability, just in opposite directions. Getting it right per SKU is what avoids paying for both mistakes on different parts of the catalog at once.
Keeping the number current without recalculating it by hand
Safety stock isn’t a number you set once. Sales pace shifts with the season, a supplier’s reliability drifts over months, and a buffer that was right when you calculated it can be wrong six months later without anyone noticing until a stockout forces the issue. Reorder recalculates the safety stock component of every SKU’s reorder point continuously, using each supplier’s actual lead time history and each SKU’s real demand pattern rather than a number set once and left alone, so the buffer stays sized to reality even as both inputs keep moving underneath it.
FAQ
What is safety stock? The extra inventory held beyond expected demand during lead time, sized to absorb the two things that don’t go according to plan: a supplier running later than usual, and a sales period running hotter than average.
How do you calculate safety stock without complex statistics? Subtract expected demand during lead time (average daily sales x average lead time) from your worst-case demand during lead time (max daily sales x max lead time), using real numbers from recent order history rather than a projected standard deviation, the same practical approach reorder point math uses for the rest of the formula.
Should every SKU have the same safety stock buffer? No. A flat buffer overprotects steady, predictable sellers and underprotects erratic ones, which is why safety stock needs to be calculated per SKU using that SKU’s own demand and lead time variability, something Inventory Tracking has to stay accurate for the calculation to mean anything.
Does a longer supplier lead time always mean more safety stock? Not the average lead time on its own, it’s the variability in that lead time that matters most. A supplier with a long but consistent lead time can need less buffer than one with a shorter average that occasionally runs weeks late, which is also why multi-location inventory can change the right number per location, not just per SKU.
How much safety stock is too much? When the buffer is protecting against a scenario that essentially never happens for that SKU, and the cash tied up in it would be better used elsewhere, sitting instead as dead stock rather than a useful cushion against real variability.